Figures Obtained with the Significance Test Results
Significance Test Plot
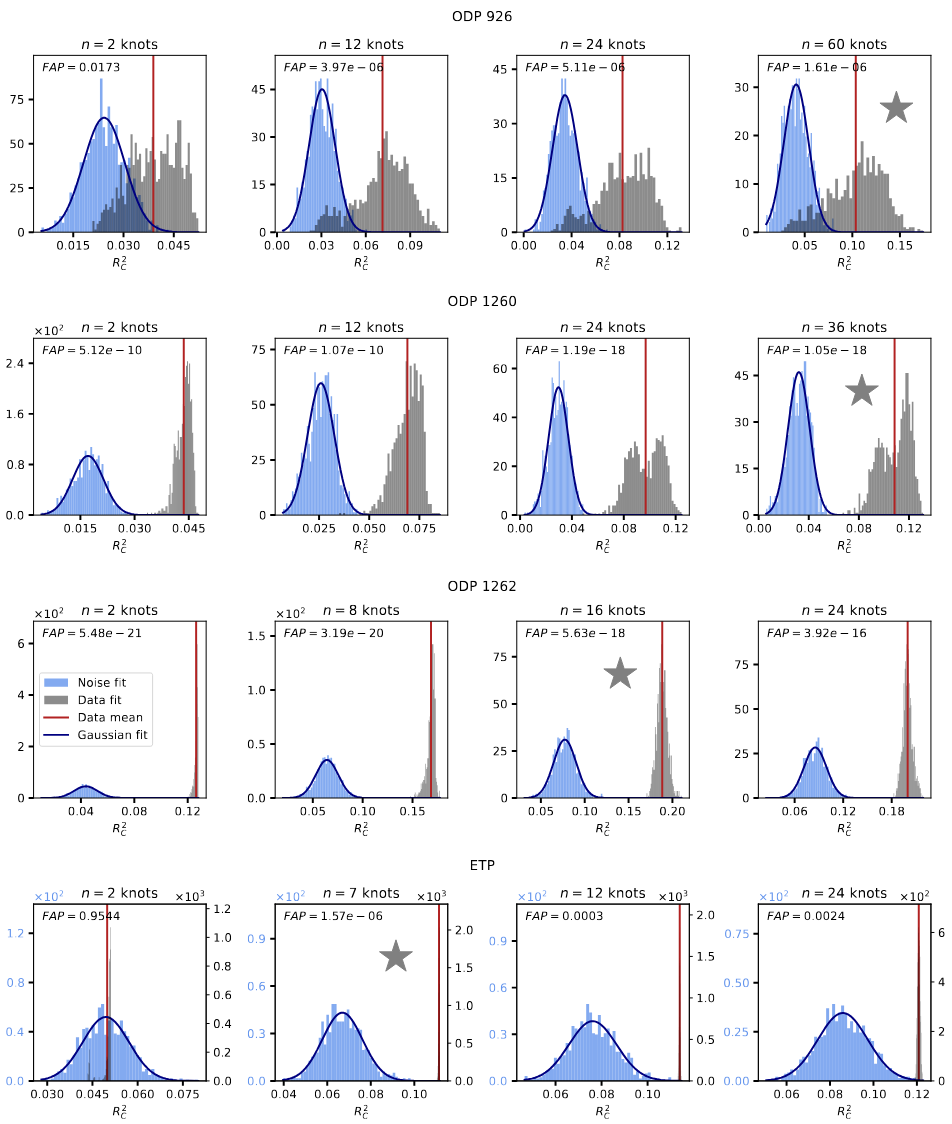
This figure provides a visual diagnostic for testing the significance of model fits to geophysical data, based on a Monte Carlo simulation framework. Each panel corresponds to a different dataset and model complexity, and illustrates whether the observed fit can be reasonably attributed to noise or not.
This figure helps to determine whether a fitted model captures genuine signal features or whether its performance can be explained as fitting random noise.